Deep Dive into NativeScript 3.1 Performance Improvements
Performance has been a high priority feature for NativeScript throughout the framework’s evolution. During the course of development, we’ve developed tools to instrument all of the Objective-C, Java, C, C++, and JavaScript code NativeScript uses, but so far these profile traces were kept for internal use only and never made it to the distributed version of NativeScript.
With 3.1 we have merged the manual instrumentation tooling and enabled all {N} apps to trace execution times of some key components. In this article you’ll learn how to enable this instrumentation, and then how to use the tooling to build NativeScript apps that start up fast.
Enable Traces
In your app’s app/package.json file, add a new profiling property and set its value to timeline:
{
"main": "MyApp",
"profiling": "timeline"
}
This will enable the traces and will output times in the console directly.
The feature is in an experimental state and we are fine tuning it with the @next releases of NativeScript. Therefore, if you want to try profiling with this tooling consider installing the next versions of the tns-core-modules and the runtimes so you have the latest and greatest code to work with.
tns platform add android@next
npm i tns-core-modules@next
Regardless of whether you use the profiling tools that shipped with 3.1, or the version in the @next releases, when you run your app you should a whole bunch of log entries that look like this.
CONSOLE LOG Timeline: Runtime: Expose: UIViewController (98155132.912ms - 98155218.291ms)
CONSOLE LOG Timeline: Runtime: Expose: UIView (98155124.914ms - 98155221.567ms)
CONSOLE LOG Timeline: Runtime: Expose: UIResponder (98155124.841ms - 98155234.224ms)
CONSOLE LOG Timeline: Runtime: Expose: UIScreen (98155124.591ms - 98155238.539ms)
CONSOLE LOG Timeline: Runtime: require: /app/tns_modules/tns-core-modules/utils/utils.js (98155114.122ms - 98155239.010ms)
CONSOLE LOG Timeline: Runtime: require: /app/tns_modules/tns-core-modules/image-source/image-source.js (98155239.113ms - 98155260.134ms)
CONSOLE LOG Timeline: Runtime: require: /app/tns_modules/tns-core-modules/ui/styling/background.js (98155097.347ms - 98155268.315ms)
CONSOLE LOG Timeline: Runtime: require: /app/tns_modules/tns-core-modules/ui/core/properties/properties.js (98155295.330ms - 98155313.461ms)
The traces times are the start and end time of the event in milliseconds since 1970. You now get an overview of the processes that take place during your app's execution, and how long they take.
Tooling
In their raw state, the logs are barely readable to the naked eye. There is a small tool that can collect the traces and visualize them in an HTML flame chart. To install the tool run the following command:
npm i -g timeline-view
Next, run your app again and pipe the output through the timeline-view tool:
tns run android | timeline-view
tns run ios | timeline-view
Run the app, perform the actions you want to test, and then click Ctrl + C in the terminal to break the CLI execution. The timeline-view tool will collect the traces before exit and generate the report. It will print the location of the report in the terminal so you can open it easily in a browser.

Let’s look at how we can use this tooling to help improve the performance of a real app.
Practice Buddy
Practice Buddy is a NativeScript + Angular app that helps music teachers work with their students. Music students use the app to record practice sessions that their teachers can listen to and provide feedback. Kudos to Jen Looper.
The app makes a great example of the timeline and performance improvements for 3.1. Here is the breakdown:
Android
Timeline: tns run android
Here are the numbers you get by updating PracticeBuddy’s app/package.json file to enable tracing and running the app with:
tns run android | timeline-view
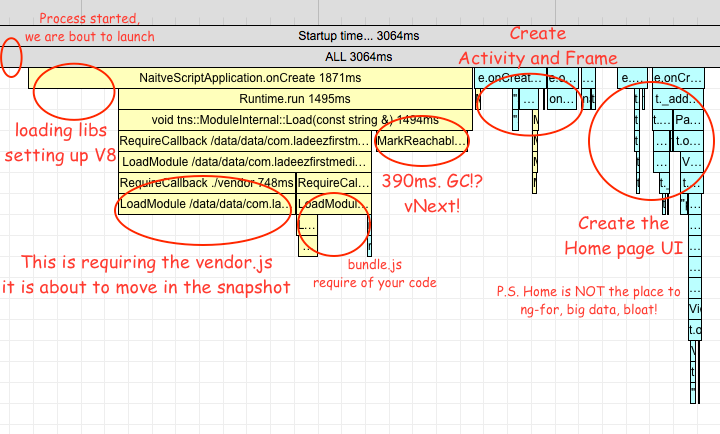
Android vanilla run HTML times report.
- 2100ms in extracting assets
- 2200ms in initializing the runtime
- 1350ms in requiring modules - tns-code-modules, angular etc.
- 750ms in MarkReachableObjects (GC)
- ~2000ms in making NativeScript views
All of this adds up to a total of about 9 seconds.
Timeline: npm run start-android-bundle --uglify
The vanilla tns run doesn't incorporate the webpack and the Angular tooling. To see the difference adding these optimization steps makes, let’s run the app again with webpack using:
npm run start-android-bundle --uglify | timeline-view
Android bundle and uglify HTML times report.
- 180ms in extracting assets
- 180ms in initializing the runtime
- 750ms in executing the vendor.js file
- 320ms in executing the bundle.js file
- 390ms in MarkReachableObjects (GC)
- ~1000mx in making NativeScript views
All of this adds up to a total of about 3 seconds.
Please note the stock webpack config for NativeScript apps splits the app in two main chunks - vendor and bundle. Vendor is supposed to contain all the modules from node_modules, and bundle is supposed to contain all modules from the app folder.
Timeline: npm run start-android-bundle --uglify --snapshot
To keep these optimizations going, let’s next add the shiny new local V8 snapshot android feature:
npm run start-android-bundle --uglify --snapshot | timeline-view
Here are the numbers from that run:
Android bundle, uglify and snapshot HTML times report.
The times shrink further:
- 230ms in extracting asset
- 230ms in extracting assets
- 100ms in runtime initialization
- 280ms in running starter js
- ~1100ms in making NativeScript views
- 480ms in MarkReachableObjects (GC)
This time we have a total of about 2.5 seconds.
Extracting Assets?
The “extracting assets” portion of the profiling is the time it takes to read JavaScript, XML, and CSS files. But why do we need assets extraction when webpack can pack them all as JavaScript strings and they can actually get in the snapshot? These assets are extracted only once on the very first app launch. Subsequent launches won't include that time. So this is something we may consider handling better in distant future but at the moment is a task with low priority.
MarkReachableObjects?
This is the bad guy we have on our roadmap to deal with in the near future. Basically, when you create a function and enclose some objects in JavaScript, and pass this as implementation for a Java interface, the NativeScript framework has to keep the Java objects alive while the function is alive in JavaScript. This happens upon garbage collection, NativeScript will walk up the JavaScript function’s object graph and reference potential Java objects so they survive the Java garbage collection. This hasn’t been an issue in vanilla NativeScript applications nor the Android Runtime unit tests as the object graphs there are relatively small. Now with the snapshot we try to put all the JavaScript up front in the vendor.js and feed the heap as early as possible, making larger heap and affecting negatively the MarkReachableObjects.
What was the V8 Snapshot Again?
There is an extensive blog of what snapshots are and how to enable them by Ivan Buhov.
What the snapshot does is to run a command line tool on your Mac. (The snapshot generation feature is limited to macOS and Linux currently, see the link above for details.) The tool executes all the JavaScript from your vendor.js in a V8 instance, and then captures the in-memory objects into a big (increases app size) blob. When the app starts, instead of parsing and executing your JavaScript, the app just loads the blog into memory and continues.
Every time the app starts on a device it feels like a gamer is resuming a saved game—the app doesn't have to replay the loading, parsing and execution of the JS.
So How to Maximize the Benefit of it?
There are two quick things you can do to maximize the start-up performance of your app.
- First, minimize the amount of JavaScript your app requires.
- Second, move as much JavaScript as possible to your vendor.js file so it makes its way to the snapshot.
Running the timeline-view shows slow require paths. You will be surprised the amount of unused JavaScript your average NativeScript app might be in. Here are a few examples we’ve found.
- Alexziskind1's looptidoo that depends on a library called faker, and faker requires 30+ small locale files. (Your app will rarely need more than one.)
- The nativescript-marketplace-demo has a page that displays source code that uses highlight.js. Highlight JS has support for many languages (and the app requires them), but the app itself only needs highlighting for XML and JS sources.
- Practice Buddy requires the root of Rx.js, while in general when working with Rx.js you can require just use a handful of operators.
To further optimize the startup time for the Android version of Practice Buddy we added the following lines to that app’s vendor.ts file:
require("rxjs");
require("nativescript-angular/animations");
This saves another 200 ms during startup, as those files are now included in the webpack bundling, and therefore also the heap snapshot.
Webpack Bundle Analyzer
Finding chunks that should be moved from the bundle.js to vendor.js is easily done using the webpack-bundle-analyzer and has been covered in the 'Using Webpack to Bundle Your Code' NativeScript article.
In general you should move everything from node_modules to the vendor. This is done by requiring the modules in the vendor.js. However some plugins that use native Android APIs will have to be refactored as the native APIs are not exposed during the snapshot generation. You can check the PR for the nativescript-plugin-firebase made by Stanimira Vlaeva, as it provides a good example of wrapping access to Android Java classes in functions and delaying their execution until runtime. When it is merged, a require("nativescript-plugin-firebase") should be added to the vendor.ts file of any apps that use that plugin.
Now this is the webpacked and uglified Android version of the app in 3.0.0, with explanations of the main times and what is expected to happen by adding the 3.1.0 snapshot feature:
Now that we’ve thoroughly broke down the Android loading process, let’s shift our attention over to iOS.
iOS
Timeline: tns run ios
Here are the stats on running a vanilla NativeScript iOS build and piping the data to the timeline-view tool.
tns run ios | timeline-view
iOS vanilla run HTML times report.
- 400ms in preparing for live-sync
- 500ms in waiting for debugger
- 900ms in require nativescript-angular/platform
-
850ms in require app.module.js
- 500ms in require rxjs/Rx.js (this time is already included as part of the app.module.js)
- ~1000ms in making views
This improves the app loading speed by about 3 seconds.
Why only 3 seconds? The first 900 ms in the stats above are debug-only steps. The waiting for debug time is removed in release and also live-sync is not available in release. So release builds will take almost 3 seconds.
Timeline: npm run start-ios-bundle --uglify
Next let’s add webpack as well as uglify minification so we get the the best possible performance out of this Angular app.
npm run start-ios-bundle --uglify | timeline-view
iOS bundle and uglify HTML times report.
- 500ms in waiting for debugger
- 400ms in vendor.js
- ~500ms in making views
That is a little under a sec if you subtract the debug-only “waiting for debugger” step.
Bundling packs all files in a single file, reducing file I/O, and uglification has much higher impact since JavaScriptCore on iOS doesn’t perform JIT compilation. The bundle extraction happens again but it is fast, in the previous case it was slow because of the number of files.
Sweet Awesomeness
Icons and Launch Screens
Icons must morph gently into launch screens and the launch screens must morph gently into your app's content. Keep that in mind when designing your assets.
For iOS the best example would be the launch of the calculator app. It brilliantly follows Apple's Human Interface Guidelines for Launch Screens.
For Android the launch animations are not as smooth as the one for iOS, besides the startup time is twice as long. But you still benefit if you follow these rules.
Flash of Unstyled Content
A flash of unstyled content is where your app briefly appears unstyled or incomplete, before the final “paint” of your app. This sort of behavior is more common on the web, where you have to wait for assets from a network, but you might experience this in NativeScript app if your startup processes involve some asynchronous tasks.
When we first started testing PocketBuddy, the app started without an action bar and drew the status bar white. What was the problem? Well, after Angular generates the home page views, the action bar is generated and styled and the status bar is rendered blue. So it appears as if the status bar is flashing. To fixing this we changed some code in the app’s main.ts file to make the action bar initially:
platformNativeScriptDynamic({ startPageActionBarHidden: false }).bootstrapModule(AppModule);
No Startup Keyboards
<activity android:windowSoftInputMode="stateHidden" ... />
Release Party at Last
Remove the "profiling": "timeline" from app/package.json before release. When building in release both the iOS and Android platforms will skip some debug stuff and hurry up a little.
Android
npm run start-android-bundle --uglify --snapshot -- --release <keystore options> | timeline-view
Subsequent hot runs get under 2 seconds for android:
adb logcat | grep Displayed
com.ladeezfirstmedia.practicebuddy/com.tns.NativeScriptActivity: +1s850ms
iOS
What if I told you it gets even better with the built-in iOS icon to launch screen grow transition and the launch screen to app fade transition? Especially when the native framework uses ref counting instead of GC.
npm run start-ios-bundle --uglify --release
I am not sure how to precisely measure the time in the release build, but here is how it looks:
What is Next
The tool makes use of some NativeScript internal knowledge and may be too verbose in some cases, but leave gaps at others. We will try to polish the position of these manually placed traces. If this turns useful enough we may try to merge the data with the timeline profiling utilities in the Web Inspector and the Chrome DevTools.